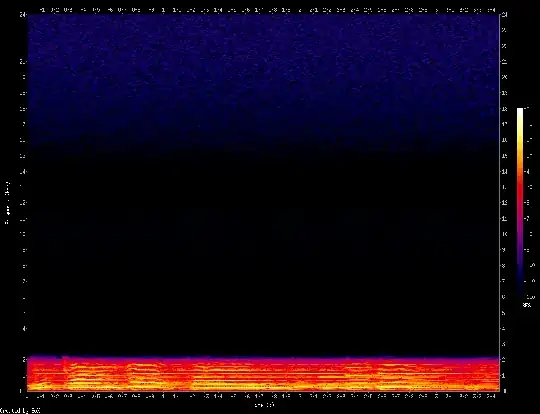
I would like to plot a spectrogram of a sound between a range of frequencies, specifically from 0 kHz to 2000 Hz. Using SoX (sox sound.wav -n spectrogram -x 1000 -y 800), I have been able to make a plot, but I have not been able to set the vertical frequency axis to the range I require:
How might this be done? I am happy to use a different program.
-ychanges the height of the image produced while-Ychanges the height of the plot as it appears in the image. Neither changes the limits or range of the vertical axis for frequency. I've confirmed this in usage tests. – BlandCorporation Jun 25 '21 at 18:26